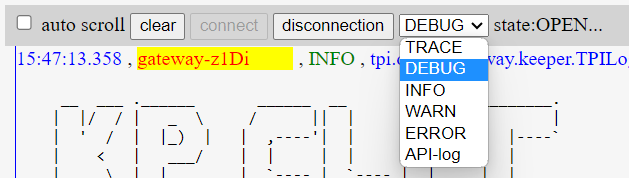
# Online Console

<mark style="color:green;">**Path: System Configs**</mark> <mark style="color:green;"></mark><mark style="color:green;">></mark> <mark style="color:green;"></mark><mark style="color:green;">**Online Console**</mark>

The system can be monitored through the **Online Console**.

<figure><img src="https://content.gitbook.com/content/0choIC1BbdPOkKWOYGgk/blobs/lVSn3fwMXsAO63DHxvfZ/image.png" alt=""><figcaption></figcaption></figure>

### System Node and Gateway Status Overview

This section includes descriptions for Node List, Thread Status, URI Status, and Who Am I.

1. **Node List**: All registered nodes in the current system.

<figure><img src="https://content.gitbook.com/content/0choIC1BbdPOkKWOYGgk/blobs/bvO4uWZ8FJwSNdGM3nji/image.png" alt=""><figcaption></figcaption></figure>

2. **Thread Status**: Current thread status of each gateway node in the system.

<figure><img src="https://content.gitbook.com/content/0choIC1BbdPOkKWOYGgk/blobs/M4hpKYyGvthUJApXJdBu/image.png" alt=""><figcaption></figcaption></figure>

3. **URI Status**: API URIs processed through the gateway.

<figure><img src="https://content.gitbook.com/content/0choIC1BbdPOkKWOYGgk/blobs/jTszH7Z0dv8WlxiWjNB4/image.png" alt=""><figcaption></figcaption></figure>

4. **Who Am I**: The gateway node currently handling the Online Console request.

<figure><img src="https://content.gitbook.com/content/0choIC1BbdPOkKWOYGgk/blobs/kA47nFtqQyUe5tWMpxM9/image.png" alt=""><figcaption></figcaption></figure>

### Application Scenarios for Online Console

In this section, you can explore the application scenarios for Online Console.

1. In order to launch the Online Console, go to **System Configs** > **Setting**, and set the value of `TSMP_ONLINE_CONSOLE` to `true`.

{% hint style="warning" %}
Based on the security policy to prevent sensitive data leakage, `TSMP_ONLINE_CONSOLE` will be automatically shut down by a housekeeping scheduled task every day at dawn. This serves as a precaution in case IT personnel forget to close it. Normally, it should be closed immediately after use to ensure information security. Any personnel changes will be recorded in the Audit log for future inquiry.
{% endhint %}

<figure><img src="https://content.gitbook.com/content/0choIC1BbdPOkKWOYGgk/blobs/6UlPgfMPNhXUmUbx8aPm/image.png" alt=""><figcaption></figcaption></figure>

2. Set the log level to view. The system defaults to **DEBUG**.

<div align="left"><img src="https://content.gitbook.com/content/0choIC1BbdPOkKWOYGgk/blobs/vH5ejwFWncvq7CPm0OWI/2.png" alt="" width="472"></div>

<table><thead><tr><th width="151">Field name</th><th>Description and Precautions</th></tr></thead><tbody><tr><td>TRACE</td><td>The primary purpose is to debug and troubleshoot, which assists developers in understanding whether a request has been modified or had headers or other metadata added during transmission, and whether it has passed through a proxy server, etc.
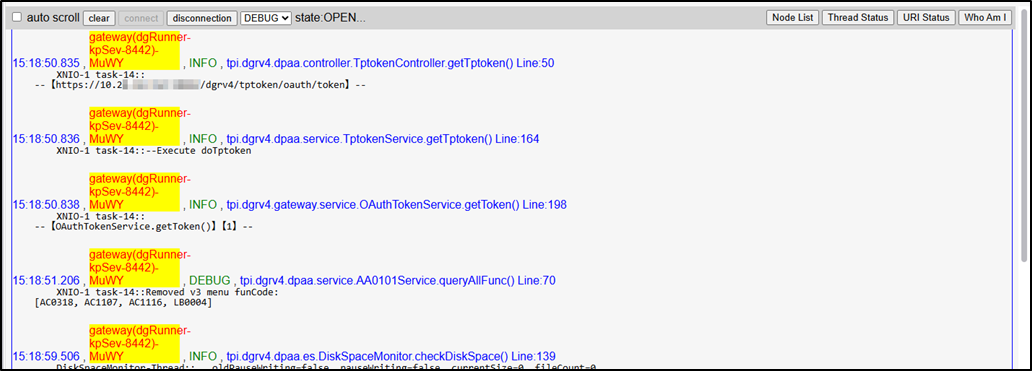
</td></tr><tr><td>DEBUG</td><td>Used for debugging and troubleshooting and allows users to view detailed debug information to help analyze and resolve issues.
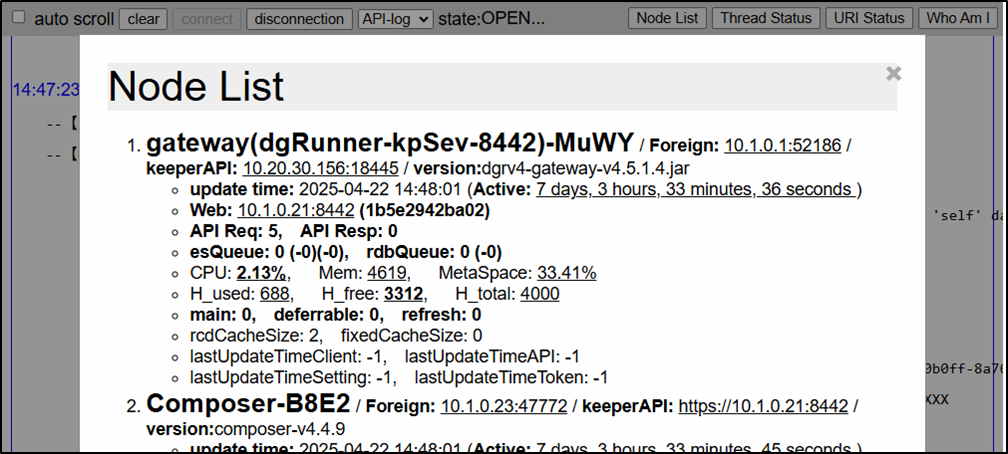
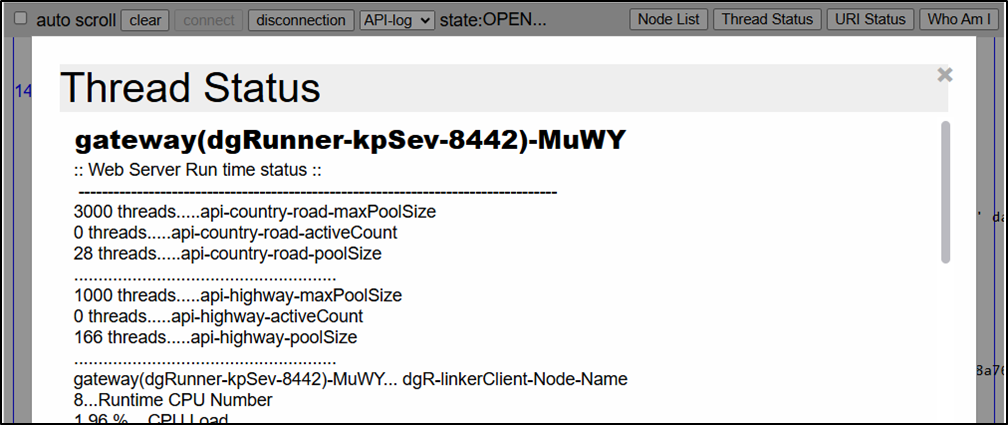
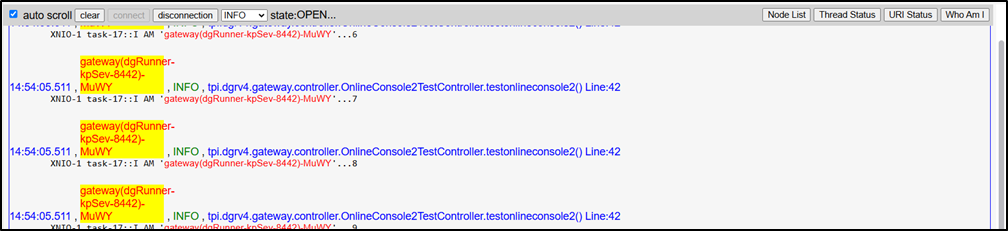
</td></tr><tr><td>INFO</td><td>Record system information, log information, service information, system monitoring.</td></tr><tr><td>WARN</td><td>Refers to the Warning information that is typically used to alert users to potential problems or errors.</td></tr><tr><td>ERROR</td><td>Refers to the Error information that is typically used to display errors or important problems in the application that may cause the application to not function properly or perform the wrong operations.
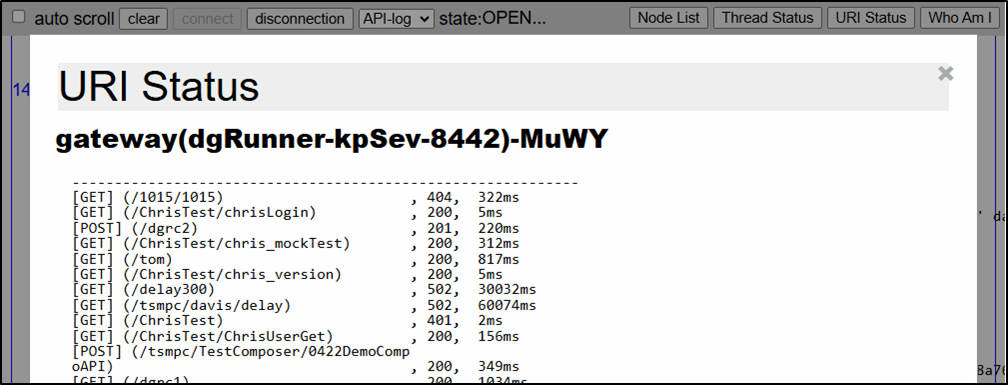
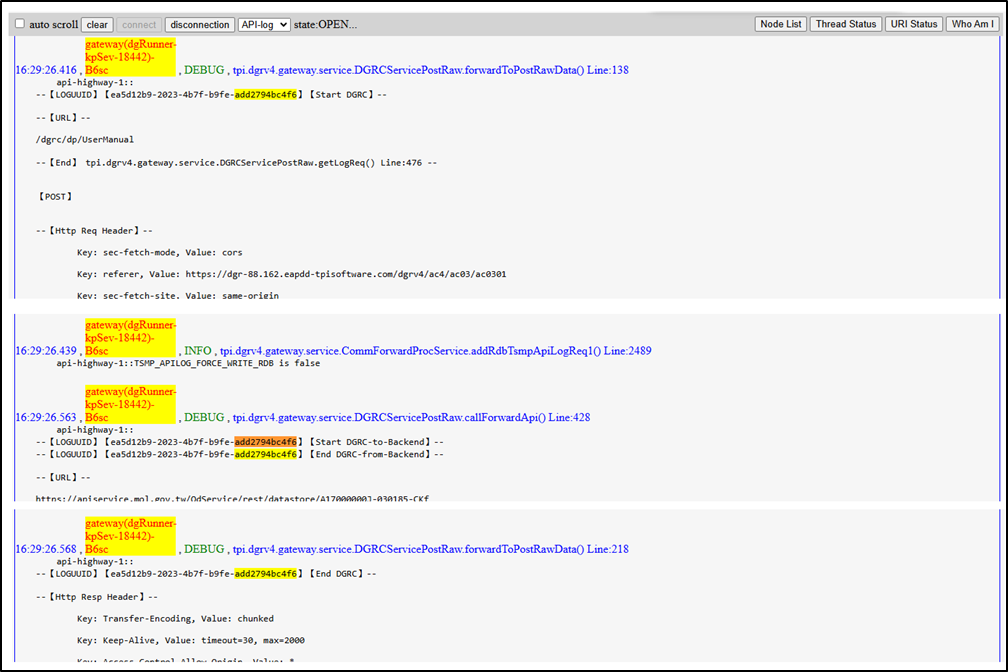
</td></tr><tr><td>API-log</td><td>The function or log used to record API requests and responses for an application or service.</td></tr></tbody></table>

3. Upon making API calls, the user can view four logs of the API via **API-log**.

<figure><img src="https://content.gitbook.com/content/0choIC1BbdPOkKWOYGgk/blobs/jTzhw4IdDHnb47mojqB1/image.png" alt=""><figcaption></figcaption></figure>

4. The four logs of the API-log are provided in the following formats.
   * The first log provides the `URL`, `Http Req Header`, and `Req payload / Form Data` formats.
   * The 2nd and 3rd log provide the `URL`, `Http Req Header`, `Req payload / Form Data`, `Http Resp Header`, `Http status code`, `Http Elapsed Time`, and `Resp payload....Return....` formats.
   * The fourth log provides the `Http Resp Header`, `Http status code`, and `Resp payload / Form Data` formats.
